Year 2 · Data and statistics — reading a scaled pictogram
How do you read a pictogram when each picture is worth 2?
Your child is working through a maths sheet, reaches a row of four bee pictures, and writes 4. The answer is 8. The reason sits in the small key at the top of the chart: each picture stands for 2, so you count the pictures first, then count on in twos.
Why the mistake is a smart one
This is not a failure of logic. It is a rule that has always worked, applied one time too many.
Until Year 2, picture charts follow one-to-one correspondence: one picture means one thing. Three apples printed on the page means three apples to count. Counting what you can see has been exactly the right move, and your child has been doing it well.
In Year 2 the rule changes quietly. The picture stops being one item and becomes a symbol standing in for a group. Nothing on the page announces this except a small key — which is precisely the part a confident child skips. Saying that out loud helps: they were not careless, the chart moved the goalposts.
The fix: three steps that untangle it
These are the same three steps the app walks through.
Step one — read the key first. Before looking at any row, point at the small box above the chart. In this one it says each bee picture stands for 2. Say it plainly: every time we see one bee, there are really two.
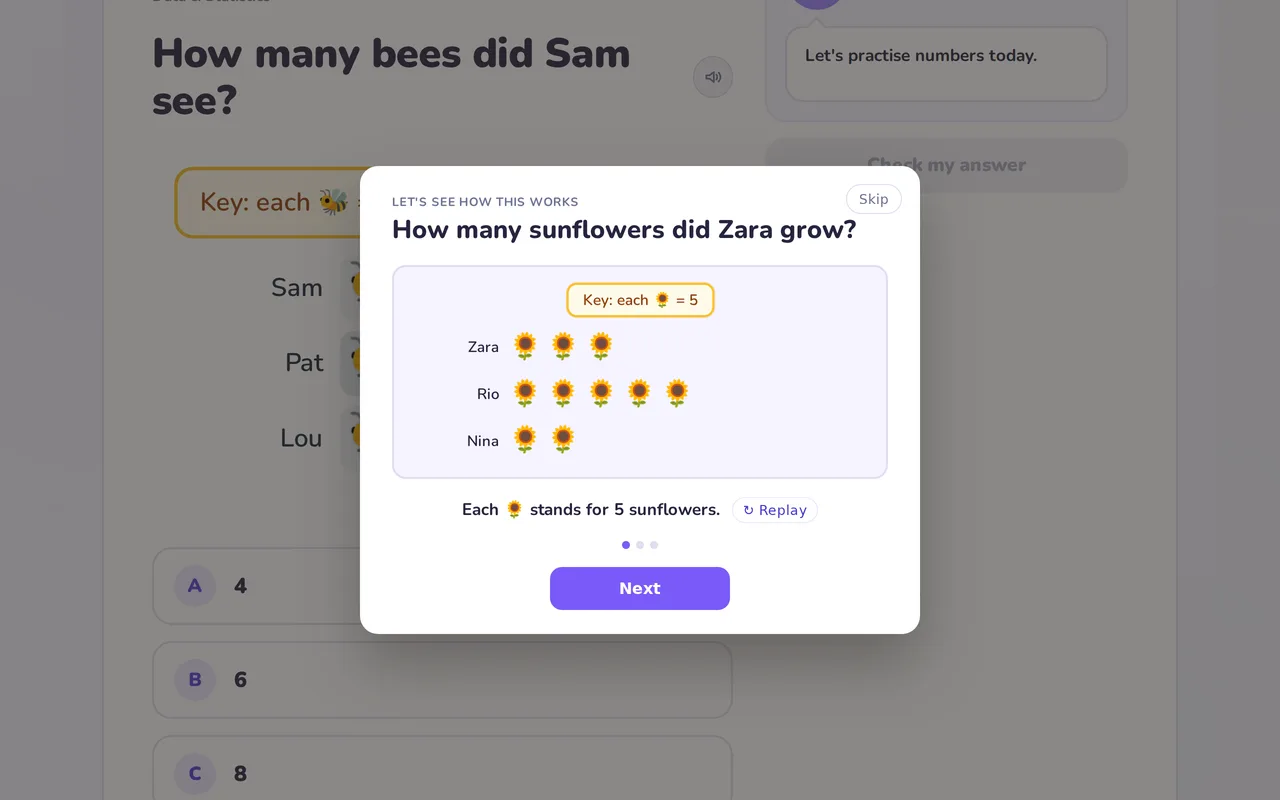
Step two — count the pictures, not the bees. Find Sam’s row and count what is actually printed: four pictures. Ask for the number of pictures, not the number of bees. Separating the two is the whole trick, because it keeps the counting honest before the value goes on top.
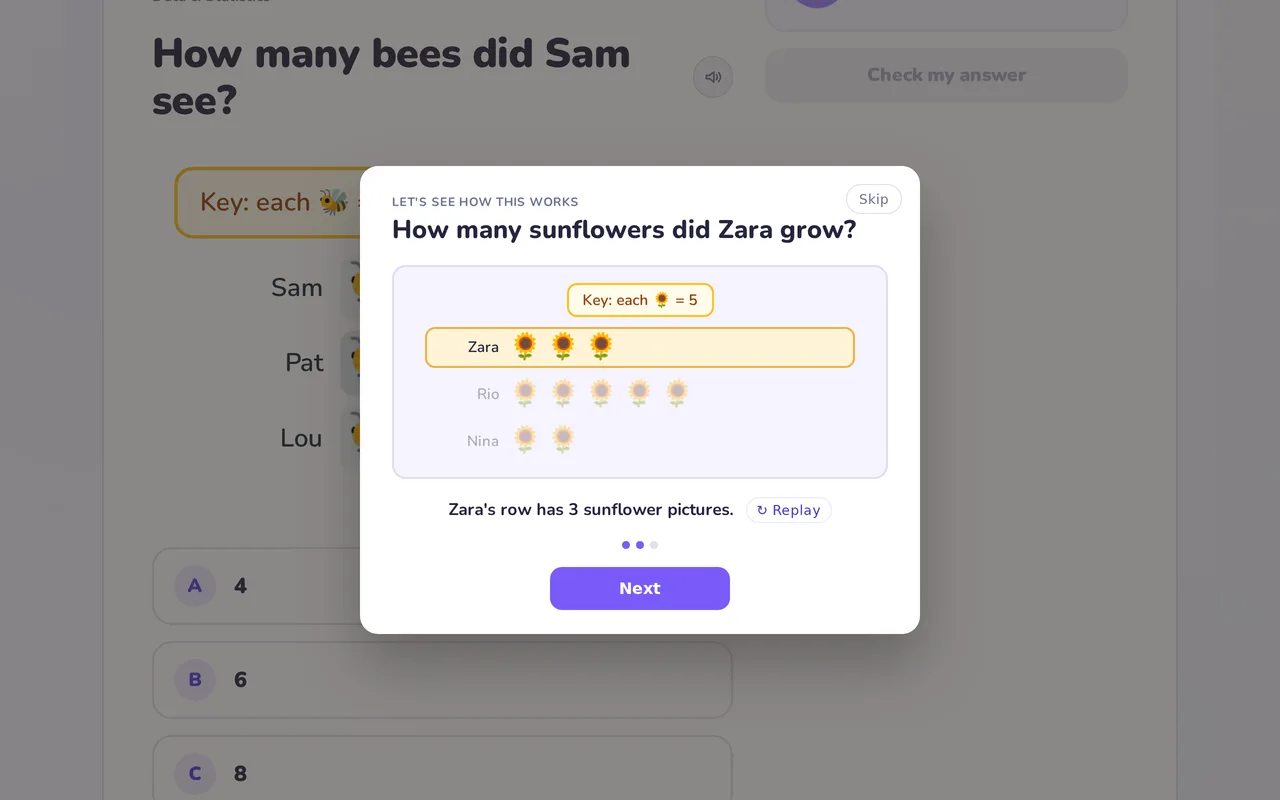
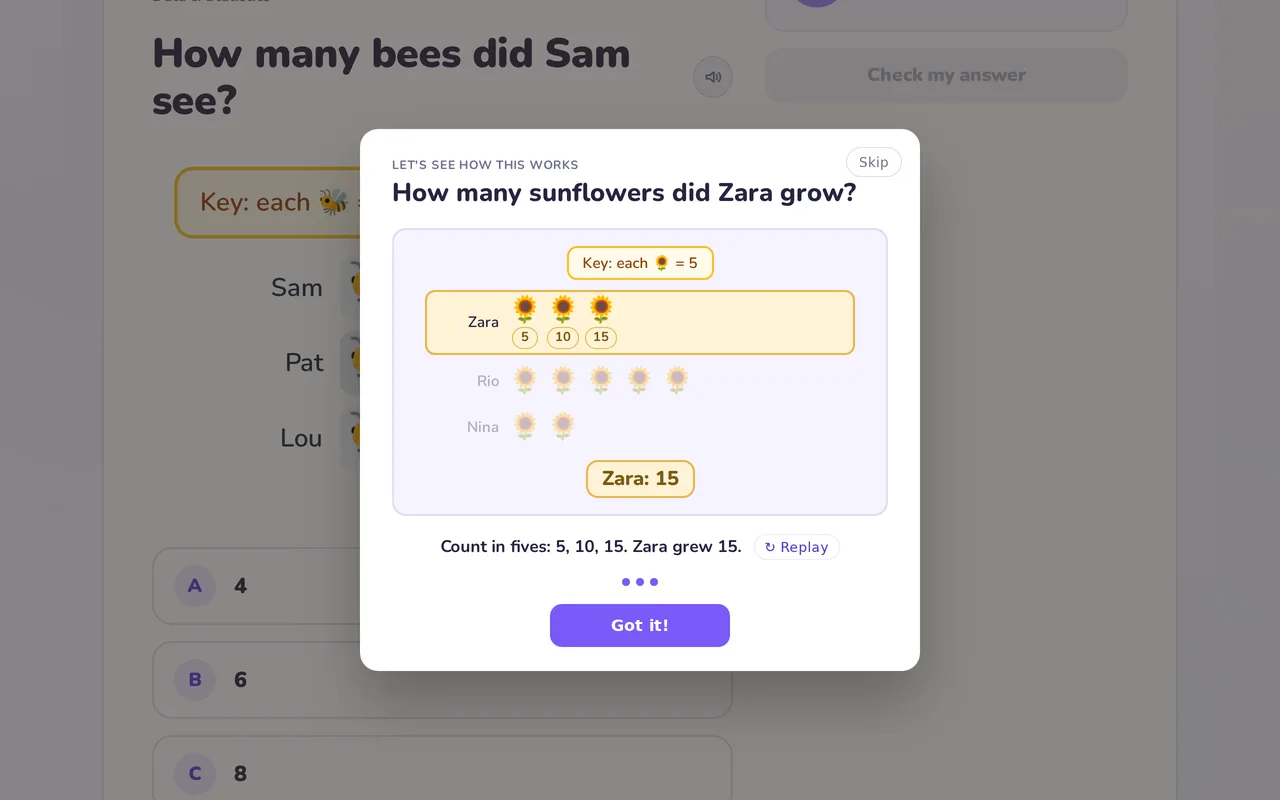
Step three — count on in twos. One jump for each picture, pointing along the row: 2, 4, 6, 8. Four pictures, each worth two, so Sam saw eight bees. Say that last line together — it joins the picture back to the answer.
What to say tonight
Three phrases that hand the thinking back to your child rather than doing it for them.
- “What does the key say each picture is worth?”
- “How many pictures are in that row?”
- “Now count them in twos — what do you land on?”
How SmartMaths handles it
More than 30 of our Year 2 questions carry this exact mix-up, labelled on the wrong answer itself. So when a child picks the count-the-pictures answer, the app knows what they meant by it, not just that they were wrong.
It does not simply mark it. A calm panel opens over the question and walks the three steps above, each one read aloud for children who are still finding reading hard. The demo deliberately works through a second chart rather than the child’s own, so they still get to solve theirs. If it has not landed, “Explain it differently” re-teaches the same question another way — a number line, a bar model, a quick sketch — until one of them clicks. You can see the rest of the year on our Year 2 maths practice page.
SmartMaths is very affordable tutor-style maths at home — it explains mistakes the way a tutor would; free trial at smartmaths.ai.
Common questions
What is the key on a pictogram?
The key is the small note at the top or side of a chart telling you how many real things one picture stands for. Without it you cannot know what the chart is saying, which is why reading it first is the habit worth building.
What are children expected to do with pictograms in Year 2?
They move past one-to-one charts and both read and draw pictograms where each picture is worth 2, 5 or 10. It is an early step towards multiplication, and towards scaled graphs later in primary school.
Why does my child get exactly half the right answer on picture charts?
When each picture is worth two and they count the pictures instead of the values, the total comes out at exactly half. It is a reliable clue: a halved answer usually means the key was skipped, rather than the counting going wrong.